

.png)
In this edition
This quarter’s energy replay looks at how wholesale electricity markets moved through Q1 2026, what shifted beneath the surface, and what those changes mean for commercial energy users heading into Q2 2026 and beyond.
Published April 2026
Quick Summary
Q1 2026 brought welcome relief for energy buyers. Futures prices fell steadily from the elevated levels seen in Q4 2025, with NSW and QLD hitting two-year lows in January as oversupply and mild weather conditions drove the market down.
The story changed in March. Escalating conflict in the Middle East sent global gas markets into sharp focus, and because Australian electricity prices are closely tied to gas, the impact was immediate. Futures prices rebounded rapidly across all NEM states, with NSW spiking back above $105 before settling near $100 by quarter's end, while other states followed at lower price points.
The net result: despite the March recovery, Q1 2026 closed meaningfully below where Q4 2025 started, making it one of the better buying windows businesses have seen in some time. Australia's energy system is changing fast, shifting away from coal and towards renewables, batteries and flexible power.
Key Takeaways
- NSW and QLD hit two-year lows in January, continuing the slide from elevated Q4 2025 levels. March pushed prices back up on the back of Middle East uncertainty, but Q1 still closed well below where the prior quarter started.
- Conflict in the Middle East escalated in March and shook global gas markets. Prices rebounded sharply through the back half of the quarter, and the uncertainty is carrying into Q2.
- Forward electricity prices held relatively steady through Q1. The medium-term outlook is manageable, but how and when your business uses energy is now just as important as the rate you lock in.
Understanding contract years (CAL26 - CAL29)
Think of CAL26, CAL27 and so on as price tags for future years of electricity. “CAL” stands for “calendar year,” and the number tells you which year it covers. So CAL26 means all of 2026, CAL27 means all of 2027, and so on.
These contracts are traded on the ASX (Australian Securities Exchange), the same place shares in Australian companies are bought and sold. Energy traders, retailers and large businesses use these contracts to lock in a price for electricity before it is actually delivered.
Why does this matter to your business? When your energy retailer quotes you a price for a new contract, they are largely basing it on what CAL26 or CAL27 contracts are currently trading for. These prices reflect what the market believes energy will cost, factoring in expected supply, demand and risk over time.
We focus on CAL26 because it is the year most businesses are actively pricing or renewing contracts for right now. It is also the most heavily traded, which makes it the most reliable signal of where the market is heading.
State-based futures overview
Electricity prices in Australia vary from state to state, shaped by each state's mix of power plants, renewables and demand patterns. Through January and February, forward prices eased across most of the country as renewable output strengthened and supply conditions improved. That changed in March. Geopolitical escalation in the Middle East put pressure on global gas markets and drove a sharp price rebound across all NEM states, resetting where the quarter ultimately landed.
New South Wales (NSW)
New South Wales continued to be the most expensive state for electricity during Q1. Prices remained sensitive to how much coal-fired power was available, how reliable those power plants were, and how strong demand was during hot periods.
Victoria (VIC)
Victoria remained comparatively stable and lower in price than NSW. A combination of wind and solar energy, along with brown coal generation, continued to keep prices from swinging too wildly.
Queensland (QLD)
Queensland carried higher structural risk throughout the quarter, meaning the state’s grid relied heavily on coal, was exposed to gas prices during peak demand times, and had limited ability to import power from other states when it needed to.
South Australia (SA)
South Australia’s prices were largely driven by how much renewable energy, mainly wind and solar, was being generated at any given time. When renewables were strong, prices fell. When they eased off, prices spiked quickly.
How states compared vs Q1 2025
Every state closed Q1 2026 below where it finished Q1 2025, good news for businesses looking to lock in better rates. Queensland saw the biggest improvement, with prices falling 22% on the back of stronger renewable output and softer demand. NSW delivered a 16% saving, dropping back below $100/MWh for the first time in some time. Victoria eased 8%, continuing its reputation as the most stable market in the NEM. South Australia decreased by 4%, with its higher reliance on gas keeping prices from falling as far as other states. If your contract is up for renewal, Q1 2026 offered one of the better entry points seen in years. Speak to a Zembl Energy Consultant to find out if now is the right time to act.
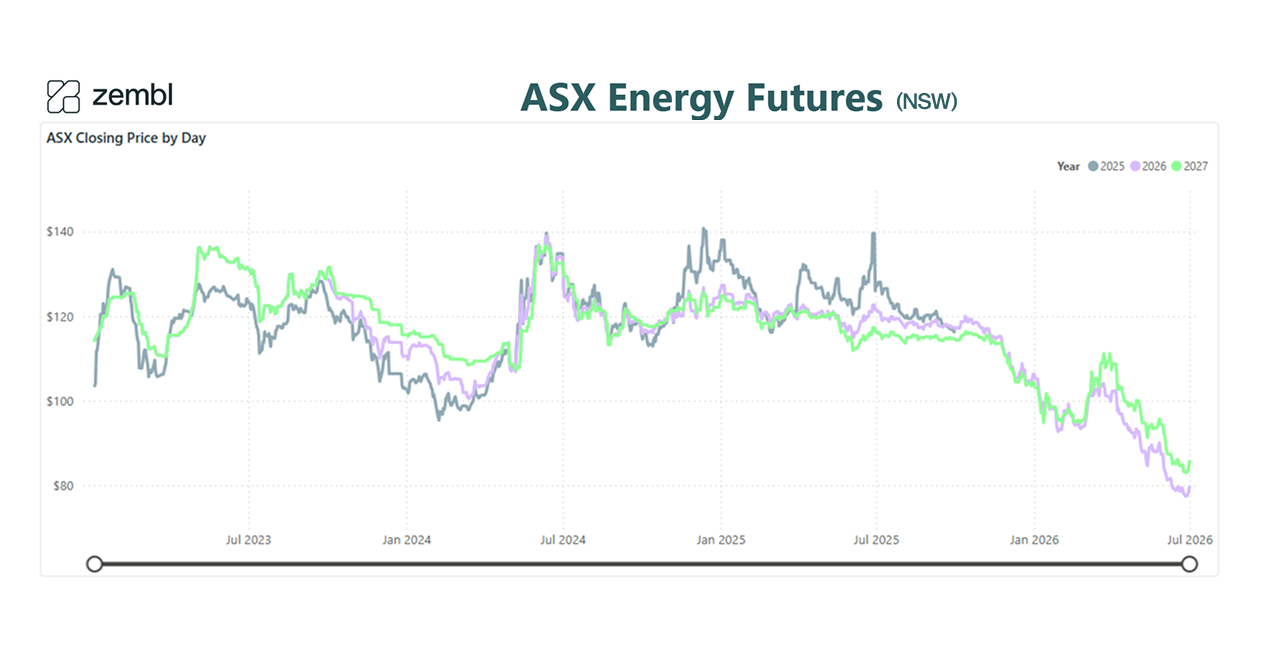
ASX Energy Futures Q1 CAL26: NSW
.png)
Source: ASX Energy Futures, NSW, January - March (Q1 2026)
What happened in Q1
NSW CAL26 futures declined through January, falling from around $105/MWh to the low $90s/MWh range by mid-February. Prices then rebounded through March, briefly spiking back toward $105/MWh before easing to around $99-100/MWh by quarter end.
Note: MWh stands for megawatt-hour, the standard unit used to measure and price electricity in bulk. Think of it like a “tank” of electricity. The higher the price per MWh, the more expensive your energy bill.
What drove the move
- Changes in outage expectations: when a power plant breaks down or goes offline for repairs, the supply of electricity drops and prices rise.
- Shifts in supply confidence: how certain the market is that enough power will be available to meet demand.
- Seasonal demand impacts: hot weather in January drove higher electricity use as air conditioning ran flat out, putting upward pressure on prices.
NSW remained the highest-priced major region, reflecting ongoing supply tightness.
What it means for businesses
Price movements in Q1 highlight how quickly conditions can change. Contract structure and timing remain critical, locking in at the wrong moment can be costly.
ASX Energy Futures Q1 CAL26: VIC
.png)
Source: ASX Energy Futures, VIC, January - March (Q1 2026)
What happened in Q1
Victoria CAL26 futures followed a similar pattern to NSW, declining from around $75/MWh in January to around $65/MWh by mid-February. Prices then recovered through March, reaching around $68-70/MWh by the end of the quarter.
What drove the move
- Renewable contribution: how much solar and wind energy was feeding into the grid at any given time.
- Generation availability: how many power plants were online and operating at full capacity.
- Supply risk expectations: the market’s view of how secure and reliable supply will be in the coming months.
Victoria continued to show relative stability compared to other regions.
What it means for businesses
Stable conditions can reward patience and good timing, but longer-term exposure still depends on how generation and transmission infrastructure develops across the state.
ASX Energy Futures Q1 CAL26: QLD
.png)
Source: ASX Energy Futures, QLD, January - March (Q1 2026)
What happened in Q1
Queensland CAL26 futures declined through January, falling from around $85/MWh to the mid-$70s/MWh range by mid-February. Prices stabilised through February before recovering through March, finishing the quarter around $80/MWh.
What drove the move
- Coal availability: how reliably Queensland’s coal-fired power stations were operating.
- Demand expectations: forecasts of how much power businesses and households would need over coming months.
- Gas pricing influence: Queensland uses gas to fill gaps in power supply during peak times, and gas prices directly affect electricity prices when this happens.
Queensland remained structurally higher risk despite short-term price movements.
What it means for businesses
Timing remains critical for Queensland businesses. Volatility can return quickly, particularly during peak demand periods or when coal plant outages occur.
ASX Energy Futures Q1 CAL26: SA
.png)
Source: ASX Energy Futures, SA, January - March (Q1 2026)
What happened in Q1
South Australia CAL26 futures opened around $87/MWh in January, dipping to around $83-84/MWh through early February. Prices then rose steadily through March, finishing the quarter in the low-to-mid $90s/MWh range.
What drove the move
- Renewable output: how much wind and solar power was generated across the state.
- Weather patterns: cloud cover, wind strength and temperature all directly affect how much renewable energy is produced at any given moment.
- Demand levels: overall electricity usage across households and businesses throughout the quarter.
South Australia continued to reflect renewable-driven variability, with prices moving quickly in response to weather conditions.
What it means for businesses
Favourable renewable conditions can soften prices quickly in SA, but volatility remains closely tied to weather. Businesses should plan for prices to swing more than in other states.
Every state told a different story in Q1 2026, but the message for businesses is the same: contract structure and timing matter. Whether your renewal is coming up or you just want to know where things are heading, Zembl's energy experts can help you make the right call.
Generation mix and supply trends
Q1 2026 did not behave as a single, uniform market. It split into three distinct phases.
January: Heat and outages
High demand from air conditioning collided with power plants going offline, creating sharp price spikes across multiple regions. January was heat-driven and outage-sensitive.
February: Renewables lift
Solar and wind output increased significantly across the country, pushing more low-cost power into the grid and driving prices down. The market softened noticeably compared to January.
Early-to-mid March: Gas uncertainty bites
The geopolitical escalation at the end of February began to feed through into Australian energy prices in early March. Asian LNG spot prices spiked sharply, and because Australian domestic gas prices are closely linked to global export markets, upward pressure flowed through quickly. This was a key driver of the price rebound seen across all state futures charts through March, with market forces that had been moving in a positive direction pushed higher by an external shock.
Late March: Too much of a good thing
Even as gas markets tightened on the back of the Middle East conflict, a different challenge was playing out on the grid itself. By late March the problem had shifted from "not enough power" to "too much power at the wrong time." So much solar was being generated in the middle of the day that the grid had to work hard to stay balanced, a sign of how dramatically the market has changed. These two forces, a global gas shock driven by geopolitical conflict and a domestic solar surplus, were pulling in different directions within the same quarter.
Renewable growth in numbers
Australia’s renewable energy share is growing fast. In February, renewables supplied around 47% of total electricity generated across the National Electricity Market (NEM), the interconnected electricity grid covering Queensland, New South Wales, Victoria, South Australia and Tasmania. Carbon emissions from electricity generation fell 4.3% year on year, meaning the grid is producing less pollution per unit of electricity than it was 12 months ago.
Battery storage is scaling fast too. In February, batteries across the grid discharged 244 GWh of electricity, more than 260% higher than the same month the previous year. Batteries store excess solar power during the day and release it during the evening peak, reducing the need for expensive gas-fired generation.
Regional highlights
- Queensland recorded its lowest monthly gas generation since 2006.
- South Australia hit record renewable output.
- NSW battery discharge reached a new monthly high.
- Victoria added new wind capacity, pushing total installed wind above 6 GW, enough to power millions of homes.
Coal is still doing the reliability work; it remains the backstop that keeps the lights on when renewables are not producing. But it is no longer setting the direction of the market.
The system is transitioning. The pricing signals are starting to follow.
Source: AEMO market data, Open Electricity (January 2026), Shell Energy Monthly Market Report (February 2026)
.png)
Supply-side developments
This quarter was less about a single dramatic event and more about the pace of new energy infrastructure being built and whether it is keeping up with the system’s needs.
New projects coming online
- Orana BESS, NSW (415 MW / 1,660 MWh): BESS stands for Battery Energy Storage System. This large-scale battery in central-west NSW can store and release enough electricity to power around 150,000 homes for approximately four hours. Projects like this are critical to replacing the reliability that coal plants have traditionally provided.
- Bungama and Clements Gap batteries, SA: further expanding South Australia’s already-significant battery capacity.
- Golden Plains West wind farm, VIC: one of Australia’s largest wind farms, adding significant renewable capacity to Victoria’s grid.
Is it enough? The capacity gap
AEMO, the Australian Energy Market Operator, the body that oversees and manages the national electricity grid, reports 4.4 GW of new capacity was commissioned in FY2024–25. (GW stands for gigawatt; one gigawatt can power roughly one million homes). However, AEMO estimates the system needs between 5.2 GW and 10.1 GW of new capacity every year over the next five years to keep pace with growing demand and the retirement of older coal plants. There is a gap.
Remaining risks
- Queensland reliability gap (80 MW, 2025–26), there may be moments when Queensland does not have quite enough generation capacity to meet peak demand without drawing on connections to other states or emergency measures.
- Shifting coal timelines: some plant closures have been delayed, others brought forward, adding uncertainty to supply planning for the years ahead.
The bottom line: supply is improving, but not fast enough to remove near-term risk for businesses.
Source: AEMO, Electricity Statement of Opportunities and Reliability Outlook
Regulatory and market updates
Three regulatory shifts are reshaping the market for commercial energy users.
1. Significant Price Reporting Guidelines (AER)
The Australian Energy Regulator (AER), the government body responsible for overseeing energy pricing and market rules, updated its Significant Price Reporting Guidelines on 20 January 2026. These guidelines define how extreme price events are measured and publicly reported, which affects how energy retailers and large users manage risk and meet their compliance obligations.
Instead of focusing mainly on extreme price spikes, the new criteria take a broader, more flexible approach, capturing not only high-price events but also sustained volatility, unusual pricing patterns, and increasingly important low or negative price conditions. The framework now explicitly considers the overall impact on system reliability, security, and market participants, rather than just the price level itself, and allows the AER discretion to investigate events that reflect emerging risks in a more complex, renewables-driven market. This change better aligns reporting with current NEM dynamics, where factors like rooftop solar variability, minimum system load events, and network constraints are becoming as significant as traditional supply shortages.
2. Price-Responsive Resource Integration
“Price-responsive resources” is a term for devices and systems; such as batteries, rooftop solar panels and controllable industrial loads, that can automatically react to changes in electricity prices. Reforms progressing this quarter aim to bring more of these into the main wholesale market so the grid can respond more efficiently to changes in supply and demand.
3. AEMO’s 2026 Integrated System Plan (ISP) Addendum
AEMO’s 2026 ISP Addendum is a supplement to the Integrated System Plan, AEMO’s long-term blueprint for how Australia’s electricity infrastructure needs to develop over the coming decades. The addendum is focused on what new transmission lines, battery storage and system integration work is needed in the near term, reflecting how rapidly the energy transition is unfolding.
Default Market Offer: What it means for your bills
The draft Default Market Offer (DMO), the regulated price cap that protects business and residential customers who have not negotiated their own energy contract, points to lower prices ahead, driven by reduced wholesale volatility and stronger renewable output. It also introduces pricing structures that reward businesses who can shift energy use to the middle of the day, when solar power is most abundant and electricity is cheapest.
The direction is clear. The market is moving toward flexibility, not just supply.
Source: Australian Energy Regulator, Significant Price Reporting Guidelines (20 January 2026)
.png)
Global risk factor: The Middle East conflict
No energy market update for Q1 2026 would be complete without addressing what happened at the end of the quarter on the global stage.
A conflict escalation at the end of February 2026 sent shockwaves through global energy markets. Qatar, one of the world’s largest exporters of liquefied natural gas (LNG), declared force majeure on LNG shipments. In simple terms, this means Qatar formally notified buyers that it could not fulfil its supply contracts due to circumstances beyond its control. The impact was immediate: roughly 20% of global LNG supply was thrown into uncertainty overnight.
What is LNG and why does it matter to Australian businesses?
LNG (Liquefied Natural Gas) is natural gas that has been cooled to liquid form for shipping. It is a key fuel source for electricity generation in Australia, particularly during peak demand periods when solar and wind are not producing enough power. When global LNG prices rise, it costs more to generate electricity using gas, and that cost gets passed through to businesses on their energy bills.
How it affected Australian prices in Q1
Asian LNG spot prices (the live market price for LNG deliveries in our region) spiked sharply, with premiums above 40% over baseline pricing at points during March. Australian domestic gas prices are closely linked to these global export prices. Even without a change in local supply volumes, when exporters can earn more selling gas overseas, upward pressure flows through to domestic energy costs.
The Australian Government moved quickly. The Minister for Resources gave notice of her intention to consider using powers under the Australian Domestic Gas Security Mechanism (ADGSM), a federal safety net that can be triggered to protect Australian households and businesses from domestic gas shortfalls. A decision is expected by mid-May 2026.
Watch this space: The risk looking ahead
The conflict remains unresolved and the situation is still developing. Key risks for Australian businesses to monitor:
- Gas and electricity price volatility: any further disruption to Middle East supply chains or LNG shipping routes could push wholesale gas and electricity prices higher, particularly into Q3 2026.
- Firming cost increases: as renewables grow, gas remains the primary backup power source. If gas becomes more expensive due to global events, the cost of keeping the lights on during low-renewable periods rises.
- Government intervention: the potential activation of the ADGSM could affect how gas is allocated domestically, with implications for both price and availability for large commercial gas users.
For Australian businesses, this is a reminder that energy markets don't operate in isolation. Global events can move local prices fast. Having an expert manage your procurement is no longer a nice-to-have. Zembl can help you stay ahead of it.
Source: Bloomberg, Australia Faces Fuel Shortages as Middle East Conflict Drives Prices Higher (March 2026), CommBank, Middle East conflict: assessing the impact across politics, economies and commodities (March 2026), OilPrice.com, Australia Considers Emergency Powers to Protect Domestic Gas Supply
Implications for commercial business energy contracts
The key shift this quarter is not just about price levels. It is about the shape of pricing, meaning how prices vary across different times of the day, week and season.
Spot prices in Q1: Two realities
Spot pricing, the live wholesale price of electricity at any given moment, showed two very different realities this quarter:
- High volatility during heat-driven periods in January, when prices spiked sharply during peak demand hours.
- An increasing frequency of very low or even negative prices, particularly in South Australia and Victoria during solar-heavy periods.
Can electricity prices actually go negative?
Yes. When there is more power being generated than the grid can use, for example, when solar output peaks on sunny afternoon generators sometimes have to pay to have their electricity taken off the grid rather than receive payment. Negative prices are becoming more common as renewable energy grows. They are good news for businesses that use energy during the day.
In January alone:
- Victoria recorded over 2,600 intervals where the price was zero or negative. The electricity market settles every five minutes, so 2,600 intervals represents roughly nine full days’ worth of near-free electricity within a single month.
- South Australia recorded over 3,000 such intervals, even more than Victoria.
That pattern of low and negative prices continued into February, even as average prices stabilised.
Forward markets: A calmer picture
Forward markets: the prices locked in today for energy to be delivered in the future, were more stable than the volatile spot prices might suggest. Pricing for FY27 (the financial year starting July 2026) remained moderate across all regions at the end of February, indicating the market’s medium-term view is relatively calm.
Gas risk: Improving, but not gone
AEMO’s analysis shows improved gas supply through to 2029, but after that, production from southern Australian gas fields is expected to decline. When gas supply falls, the cost of “firming” power (the reliable backup generation needed to support renewable energy) rises. This keeps long-term energy cost risk on the radar for businesses.
What this means for your business
A simple, flat electricity rate is becoming less and less representative of what you actually pay. What matters now:
- Load shape: the pattern of when your business uses electricity across the day, week and year. A business that uses most of its power in the middle of the day, when solar is abundant and cheap, is in a very different position from one that peaks in the early evening when prices are higher.
- Timing of usage: can you shift energy-intensive processes (like manufacturing, refrigeration or HVAC) to cheaper periods? Even small shifts in usage timing can have a meaningful impact on your bill.
- Ability to respond to price signals: businesses with the flexibility to reduce or shift consumption when prices spike are increasingly being rewarded by the market, through lower bills and new incentive structures.
The strategy is changing. It is no longer just about securing a competitive rate. It is about aligning your energy use with how the market actually behaves.
Source: Open Electricity (January 2026), Shell Energy Monthly Market Report (February 2026), AEMO, 2026 Gas Statement of Opportunities
How Zembl helps
Energy markets move fast. Q1 2026 showed just how quickly conditions can shift from opportunity to risk and back again within a single quarter.
Zembl works with businesses across Australia to cut through the complexity. We monitor the market, manage procurement end to end, and make sure you're in the right contract at the right time, so you're not caught out when things change.
Whether your contract is coming up for renewal or you just want to know where the market is heading, we can help.
Talk to a Zembl Energy Consultant today. Everything energy. Sorted.
This report is based on market observations and is intended as general information only. Pricing outcomes may vary depending on market conditions, timing and individual business circumstances. The data from the graphs was pulled on the 15 April 2026.

.png)
.png)
.png)
.svg)
