

.png)

The Australian Energy Regulator (AER) has released its final Default Market Offer (DMO) determination for 2026–27, confirming lower default electricity prices across most regions from 1 July 2026.
The final decision delivers lower prices for residential and small business customers across New South Wales and South East Queensland, while small businesses in South Australia will also see prices fall.
South Australia was the exception for residential customers, with final residential prices increasing slightly compared with 2025–26.
Most customers are not directly affected by the DMO, as the majority are already on market offers rather than standing offers. Across the DMO regions, around 77,000 small business customers remain on standing offers, representing roughly 15% of eligible customers.¹
Customers still on standing offers will see the regulated DMO price changes flow through from 1 July 2026.
While DMO prices are dropping across most regions, only customers on standing offers will automatically benefit. Most businesses will need to review their energy contract to see savings. It makes now a good time to get a Bill Comparison with an expert.
For a more in-depth understanding of the Default Market Offer, visit: https://www.defaultmarketoffer.com.au/
What changed between the draft and final decision
The AER's final determination delivered slightly different outcomes to the draft decision released in March.
While prices still fell across most regions, the final decision reflected updated wholesale market conditions, revised network tariff calculations and changes in retail cost assumptions.
The AER also noted that it monitored changing market conditions between the draft and final determinations, including the impact of the conflict in the Middle East.
Residential electricity prices
Final DMO prices for residential customers are lower across New South Wales and South East Queensland compared with 2025–26.
The largest residential reduction was recorded in South East Queensland, where prices are set to fall by 7.2%.¹
South Australia was the only region where residential prices increased, rising 1.4% from the previous year.¹
Residential DMO prices: Final determination vs draft¹
South Australia's residential increase stood out against the broader downward trend across the DMO regions.
Small business electricity prices
Small business customers recorded the largest reductions under the final determination.
Final DMO prices for small businesses fell between 6.8% and 11.3% depending on the region.¹
The largest reduction was recorded in NSW, while South East Queensland also posted a significant decrease.
Small business DMO prices: Final determination vs draft¹
The reductions were driven primarily by lower wholesale electricity costs, environmental costs and retail costs compared with the previous year.
Why prices are falling, even with higher network costs in some regions
The final determination reflects softer market conditions compared with recent years.
Wholesale electricity costs fell across all DMO regions, supported by lower contract prices, reduced spot price volatility and increased output from wind and battery generation.
Environmental costs and retail costs also declined.
But network costs moved differently depending on the region.
In some regions, network costs increased, but these increases were outweighed by larger reductions in wholesale electricity and environmental costs.
For example, parts of New South Wales and South Australia recorded higher network costs while overall electricity prices still fell.
The AER also updated parts of its DMO methodology in the final determination, including how network tariffs are blended between legacy and smart meter customers.
Why South Australia was different
South Australia was the only DMO region where residential prices increased under the final determination.
According to the AER, South Australian wholesale costs did not fall as much as other regions due to higher ancillary service costs following high-priced Frequency Control Ancillary Services (FCAS) events during July and August 2025.
That meant some of the broader cost reductions seen in other states were offset in South Australia.
Small business prices in South Australia still fell overall, but by less than the draft determination originally proposed.
Another important shift in the market
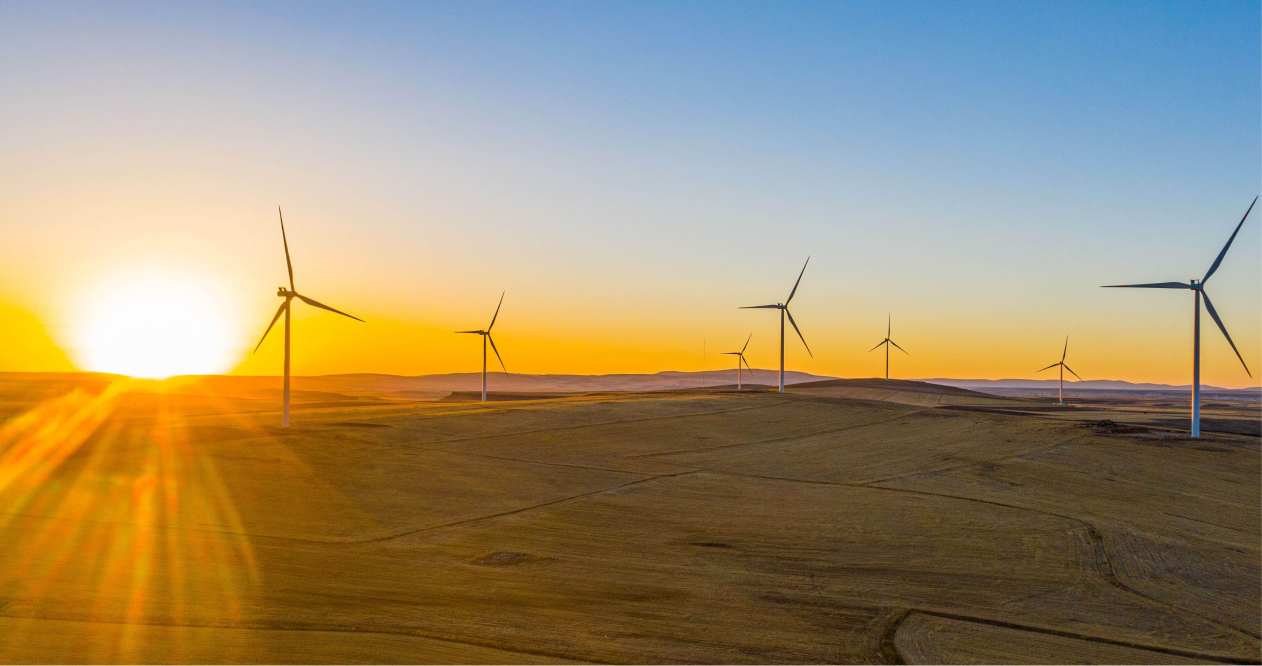
One emerging trend behind changing electricity pricing is the growing impact of daytime solar generation.
As more rooftop and utility-scale solar enters the grid, electricity prices during the middle of the day are increasingly falling. This is driving networks and retailers to introduce tariff structures designed to encourage customers to use more electricity during solar-heavy periods.
Over time, this is likely to create greater differences between daytime and evening electricity pricing as the energy market continues transitioning toward a more renewable-heavy grid.
What this means for customers
The final determination is welcome news for customers still on standing offers, although most households and businesses across the DMO regions are already on market offers and will not be directly impacted.
For customers still on standing offers, regulated electricity prices will fall across most regions from 1 July 2026.
For businesses especially, reviewing current pricing and contract structures remains important as market conditions continue to shift. With pricing conditions improving, now is a good time to check whether your current plan still suits how your business operates.
How Zembl can help
Understanding energy pricing changes is one thing. Knowing whether your business is actually on a competitive plan is another.
While the DMO sets a regulated safety-net price, many businesses are already on market offers with different pricing structures, tariffs and contract terms.
Zembl helps businesses compare their current rates against competitive market offers from leading Australian energy retailers.
All we need is a recent energy bill. From there, our Energy Experts can review current pricing, compare available options and help determine whether your business could reduce energy costs.
We handle the comparison process from start to finish, helping businesses stay in control of their energy costs without the complexity.
.png)
.png)
.png)
.svg)

