


If Q1 2026 signalled the start of a shift, Q2 proved it was real. From April through June, Australia's energy market continued its transformation: cheaper electricity, record renewable generation, and batteries becoming the market makers. Here's what happened.
The price story: Down across the board
The quarter opened with wholesale energy futures higher than expected. By June 30, every mainland state had fallen sharply.
ASX Energy Futures (Calendar Year 2026 Contracts)
Victoria's fall was the steepest. The state benefited most from the renewable surge and battery investment that accelerated through the quarter.
The average wholesale price across the NEM for Q2 2026 (April, May, and June combined) came in at $74/MWh. That's the typical price that generators received for selling electricity in the wholesale market during those three months. It's 47% lower than the same quarter last year (Q2 2025, which was April-June 2025). To put it in perspective, this is the lowest quarterly average for Q2 (April-June) that Australia has seen since 2020.
For large businesses approaching an energy contract renewal, lower wholesale prices may create an opportunity to secure more competitive contract pricing. Businesses already locked into a fixed-term contract generally won’t see these market movements reflected in their current contracted rate. A 47% fall in wholesale costs means much lower bills for users who aren't locked into longer-term agreements at higher prices.
Source: ASX Energy Futures (CAL26 contracts), AEMO Quarterly Energy Dynamics Q2 2026
State-by-state: Where prices fell fastest
New South Wales: The steady decline
What happened in Q2
NSW electricity futures for the 2026 calendar year, which indicate the market’s expectations for wholesale electricity prices, opened at $101.18/MWh and closed in June at $78.51/MWh. That’s a 22.5% fall across the quarter. The decline was steady rather than dramatic, with prices gradually trending downward through April and May before stabilising in late June.
What drove the move
- Renewable contribution: Wind and solar output ramped up significantly through Q2, with grid-scale solar and wind hitting new highs. Even though NSW didn't see the same renewable penetration as Victoria, increasing capacity still displaced coal and gas generation.
- Generation availability: Coal-fired power stations remained online, but they faced lower demand as renewables took larger shares of supply. Black coal output fell 7.3% year-on-year across the NEM.
- Supply risk expectations: Battery storage expansion reduced the market's concern about supply security during peak periods. With batteries available to discharge during high-demand hours, traders became less willing to pay premium prices for certainty.
NSW benefited from having diverse generation sources spread across its territory, which helps balance supply when renewables fluctuate.
What it means for businesses
The steady decline in wholesale pricing may create opportunities for NSW businesses approaching a contract renewal to secure more competitive pricing. Businesses already on fixed-term contracts generally won’t see these market movements affect their current contracted rate. While prices fell across Q2, transmission constraints can still contribute to higher prices during periods of peak demand, so timing remains an important consideration when renewing an energy contract.
.png)
Source: ASX Energy Futures (NSW CAL26), AEMO market data Q2 2026
Queensland: The gradual move lower
What happened in Q2
Queensland electricity futures for the 2026 calendar year (CAL26), which indicate the market’s expectations for wholesale electricity prices, started the quarter at $80.78/MWh and ended at $68.42/MWh. That’s a 15.3% decline. Queensland’s fall was gentler than NSW, partly because it started Q2 at a lower price. Prices moved downward steadily, with less volatility than some other states.
What drove the move
- Renewable contribution: Queensland's large renewable resource base, particularly solar and wind in regional areas, meant it was increasingly a net exporter of energy during sunny and windy periods. Wind generation in Queensland jumped 80% year-on-year, reaching a record 842 megawatts.
- Generation availability: Coal generation in Queensland has been resilient, but the margin for coal is shrinking. As renewables supply more baseload power, coal plants spend more time running at partial capacity or sitting idle.
- Supply risk expectations: Queensland's strong renewable output and growing battery storage reduced concerns about supply tightness. The state's position as a renewable powerhouse means it's increasingly comfortable with oversupply periods where prices dip to zero or negative territory, rather than supply scarcity.
What it means for businesses
Queensland businesses approaching a contract renewal may be able to access more competitive pricing following the fall in wholesale prices. Businesses already on fixed-term contracts generally won’t see these market movements affect their current contracted rate. Looking ahead, limits on how much electricity can be transferred between Queensland and other states could also influence prices, particularly when there is more electricity available than Queensland needs.
.png)
Source: ASX Energy Futures (QLD CAL26), AEMO Quarterly Energy Dynamics Q2 2026
South Australia: Volatility and recovery
What happened in Q2
South Australian electricity futures for the 2026 calendar year (CAL26), which indicate the market’s expectations for wholesale electricity prices, began Q2 at $93.74/MWh and fell to $79.69/MWh by 30 June. That’s a 15.0% decline across the quarter. However, prices were volatile in late June. On 21 June, South Australian spot prices exceeded $10,000/MWh for four brief periods. On 22 June, prices climbed even higher, reaching the market price cap of $20,300/MWh for 10 brief periods.
What drove the move
- Renewable contribution: South Australia has record renewable penetration, with wind and solar providing the bulk of generation. But renewable output is volatile. When wind dropped sharply on June 21-22, supply tightened suddenly.
- Generation availability: South Australia has no coal generation to call upon, so when renewables dip, the state relies on gas generation, battery discharge or interconnection to Victoria.
- Supply risk and scarcity: South Australia’s relatively limited interconnection with the rest of the NEM left the region more exposed when local supply tightened. Prolonged low wind output, constrained imports and the depletion of battery energy reserves created increasingly tight supply-demand conditions. As available supply became scarce, prices spiked above $10,000/MWh, reaching the market price cap of $20,300/MWh during the June event.
Despite the drama, average quarterly prices still fell, showing that most of Q2 was characterised by oversupply rather than tightness.
What it means for businesses
For South Australian businesses approaching a contract renewal, lower average wholesale prices may create opportunities to secure more competitive pricing. Businesses already on fixed-term contracts generally won’t see these market movements affect their current contracted rate. However, the sharp spot price spikes in June show that South Australia can still experience significant volatility.
.png)
Source: ASX Energy Futures (SA CAL26), AEMO Quarterly Energy Dynamics Q2 2026
Victoria: The biggest winner
What happened in Q2
Victorian electricity futures for the 2026 calendar year (CAL26), which indicate the market’s expectations for wholesale electricity prices, fell from $70.62/MWh to $51.93/MWh. That’s a 26.5% decline across the quarter and the steepest fall of any mainland state. Victoria also recorded the lowest average regional spot price at $50.69/MWh during Q2.
What drove the move
- Renewable contribution: Victoria has strong wind resources in the west and southwest, plus abundant solar assets across the state. Combined renewable output hit record levels in Q2, with wind and solar together providing the majority of generation for much of the quarter.
- Generation availability: Victoria hosts the highest concentration of grid-scale battery storage in the NEM. Battery discharge is increasingly covering evening peak demand, reducing how often coal and gas generation is called on to meet those hours and how frequently they set the spot price. This is compressing thermal generators' operating margins and utilisation over time, though coal and gas still play a critical role during low-wind, high-demand periods
- Supply risk expectations: The market viewed Victoria as having a reliable, secure supply thanks to its diverse generation sources and battery backup. Victoria also benefits from good transmission connections to NSW and South Australia, allowing it to balance supply across regions when needed.
What it means for businesses
Victorian businesses approaching a contract renewal may be well placed to benefit from the lower wholesale price environment. Lower prices and reduced volatility may support more competitive contract offers. Businesses already on fixed-term contracts generally won’t see these market movements affect their current contracted rate. Looking ahead, continued growth in battery storage could help support a more stable energy market, although future pricing will depend on market conditions.
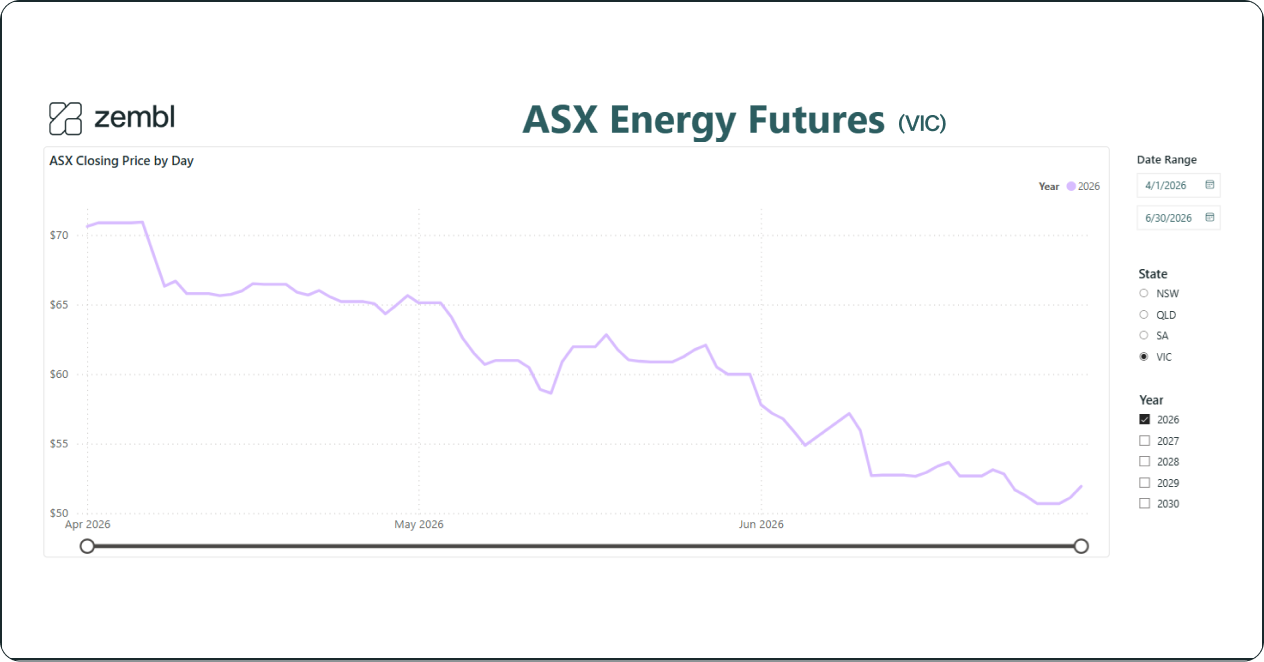
Source: ASX Energy Futures (VIC CAL26), AEMO Quarterly Energy Dynamics Q2 2026
Renewables hit a record
Here's the big story: renewable energy (solar and wind) supplied 42.1% of Australia's electricity in Q2. That's the highest amount ever. And it wasn't just one good month. It happened all three months in a row.
Where did all this renewable energy come from? Two places. First, rooftop solar panels on homes and businesses reached a record level, with over 700 megawatts (MW) of rooftop solar just in Q2 alone. That's about the same as powering a small city. Large solar farms added even more. Wind turbines also had a great quarter, generating 20% more than the same period last year.
Meanwhile, coal-fired generation continued to decline and gas output fell to its lowest level in decades as growing wind, solar and battery capacity displaced thermal generation.
Source: AEMO Quarterly Energy Dynamics Q2 2026, PV Magazine Australia Rooftop Solar Report July 2026
Batteries changed how prices work
Over the past 12 months a significant amount of battery storage has been added to the NEM, with the total installed capacity doubling to over 9,000 MW. This is now having a material impact on electricity prices, with spot prices increasingly being set by batteries (36% of dispatch intervals in Q2-26) over traditional coal and gas generation sources.
Here's why it matters. During the day when the sun is shining, there's often more cheap electricity than the grid needs. Batteries soak up that surplus and store it. When the sun sets, batteries release that power to help cover the evening peak, reducing how much coal and gas generation is needed to fill the gap. This helps smooth out price swings: batteries are increasingly setting the price outright rather than reacting to it, which dampens some of the extreme highs and lows. However, the system isn't free of volatility, as price spikes and negative pricing still happen, but batteries are playing a growing role in moderating it.
Source: AEMO Quarterly Energy Dynamics Q2 2026
Western Australia: Isolation drives higher costs
While electricity got cheaper everywhere else in Australia, Western Australia went in the opposite direction. Prices hit a record high of $117.87 per megawatt-hour, up 30% compared to last year.
Why the big difference? Western Australia doesn't have any connections to the eastern states. When its local wind farms produce less wind, or its coal plants have problems, it can't quickly import cheap power from NSW or Victoria like South Australia can. WA is basically on its own. That means when supply gets tight, prices increase. Even though WA is investing in renewables just like the rest of the country, it's not getting the price benefits because it can't balance supply across states.
Source: AEMO Quarterly Energy Dynamics Q2 2026, WEM pricing data
Gas prices fell, pollution dropped
When power plants burn less gas, the price of gas comes down. Gas prices on the East Coast averaged $9.08 per gigajoule for Q2, the lowest price since 2021. But like electricity, those benefits depend on contract timing: businesses on shorter-term gas contracts or with flexible terms will see lower costs, but those locked into longer-term agreements at higher rates won't feel the benefit immediately.
The big-picture: because renewables and batteries are doing more of the work, gas plants are being called upon less. That means less pollution. Greenhouse gas emissions from the electricity grid dropped 6.4% compared to last year. The grid is getting cleaner with each quarter that goes by.
Source: AEMO Quarterly Energy Dynamics Q2 2026
What drove it
Weather played a role. May and June were unusually warm, some of the warmest on record, meaning lower demand for residential and commercial heating. Sunny days also meant more solar panels were generating power, contributing to record renewable generation for the quarter. However, heavy rain in May created clouds that blocked some solar generation temporarily.
Source: AEMO Quarterly Energy Dynamics Q2 2026, Australian Bureau of Meteorology
What it means
Three things to watch going forward:
1. Pricing is becoming more predictable in some respects, but not uniformly. Average wholesale prices fell sharply across most of the NEM in Q2 2026, with batteries now the most frequent price-setting technology in nearly every region. But volatility hasn't disappeared: South Australia still saw an extreme price event in June, and negative pricing is becoming more frequent in high-renewable regions like Victoria and SA.
2. Regional differences are widening. Victoria, with high penetration of renewables and batteries, is becoming a more stable, low-price region. South Australia and Western Australia face tighter constraints and higher prices. If you're negotiating power contracts, location matters more now.
3. The role of fossil fuel generation is changing. Nationally, coal still supplies the largest single share of generation, but its running hours and capacity factor are shrinking as renewables and batteries take a growing share of dispatch. This is eroding thermal plants' economics and is a contributing factor behind earlier-than-planned retirement decisions across the NEM.
The broader picture: Q2 showed what a 42% renewable grid looks like. It works. It's cheaper. It's cleaner. And it's only the beginning.
How Zembl helps
Energy markets move fast. Q2 2026 showed just how quickly conditions can shift. Prices fell sharply across most of Australia, but Western Australia moved in the opposite direction. Renewable generation hit a record 42.1%, yet volatility still spiked in South Australia when the wind dropped unexpectedly.
Zembl works with businesses across Australia to cut through the complexity. We monitor the market in real time, manage your procurement end to end, and make sure you're in the right contract at the right time. Whether you're in a low-price state like Victoria or facing constraints like South Australia, we help you understand your options and capture the savings available to your business.
Q2's price movements proved that location matters more than ever. Your state, your demand profile, and your flexibility all influence how much you can save. We analyse your specific situation and help you navigate the opportunities.
Whether your contract is coming up for renewal or you just want to know where the market is heading, we can help.
Talk to a Zembl Energy Expert today.
This report is based on market observations and is intended as general information only. Pricing outcomes may vary depending on market conditions, timing and individual business circumstances. The data from the graphs was pulled on 12 August 2026.
.png)
.png)
.png)
.png)
.svg)

